Radio Inquiry Unit – Featured Source 1E
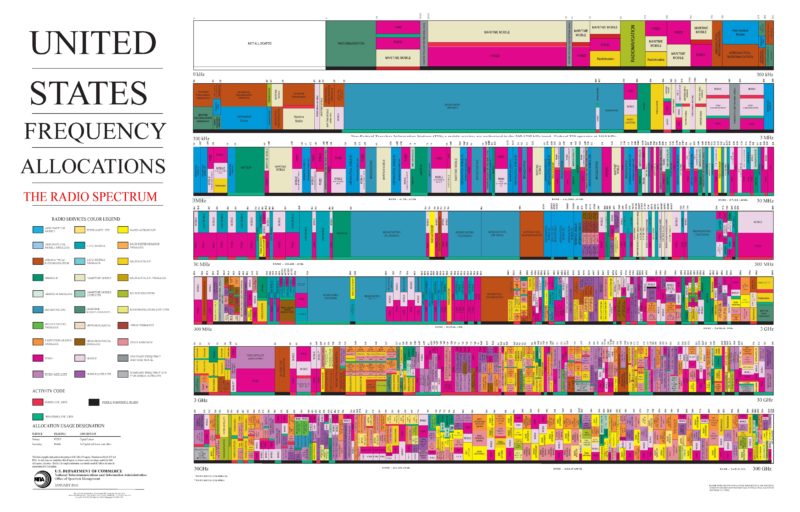
2016 chart represents a graphic single-point-in-time portrayal of the Table of Frequency Allocations used by the United States, Federal Communications Commission (FCC) and the National Telecommunications and Information Administration (NTIA).
This chart portrays the frequency allocations in the electromagnetic
spectrum for different purposes as specified by United States government. The Radio Frequency Spectrum Allocation Chart is the first and broadest level technical document to consult when planning uses for spectrum allocations in that nation’s borders.